Reference
Code
import pylab as pl
import numpy as np
# values x and y give values at z
xmin = 1; xmax = 4; dx = 1
ymin = 1; ymax = 3; dy = .5
x,y = np.meshgrid(np.arange(xmin,xmax,dx),np.arange(ymin,ymax,dy))
z = x*y
# transform x and y to boundaries of x and y
x2,y2 = np.meshgrid(np.arange(xmin,xmax+dx,dx)-dx/2.,np.arange(ymin,ymax+dy,dy)-dy/2.)
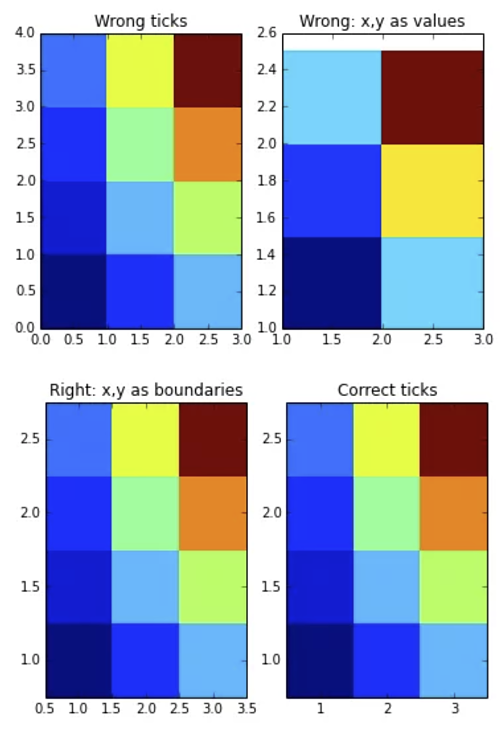
# pcolormesh without x and y just uses indexing as labels
pl.subplot(121)
pl.pcolormesh(z)
pl.title("Wrong ticks")
# pcolormesh with x and y values gives a wrong plot, x and y are treated as boundaries
pl.subplot(122)
pl.title("Wrong: x,y as values")
pl.pcolormesh(x,y,z)
pl.figure()
# using the boundaries gives correct plot
pl.subplot(121)
pl.title("Right: x,y as boundaries")
pl.pcolormesh(x2,y2,z)
pl.axis([x2.min(),x2.max(),y2.min(),y2.max()])
# using the boundaries gives correct plot
pl.subplot(122)
pl.title("Correct ticks")
pl.pcolormesh(x2,y2,z)
pl.axis([x2.min(),x2.max(),y2.min(),y2.max()])
pl.xticks(np.arange(xmin,xmax,dx))
pl.yticks(np.arange(ymin,ymax,dy))
pl.show()


Conclusion
When I store .nc files, I need to save lon_center and lat_center.
Then, I can create correct ticks when plotting:
lat,lon = np.meshgrid(np.append(lat_center-resolution/2,lat_center[-1]+resolution/2),np.append(lon_center-resolution/2,lon_center[-1]+resolution/2))
Say something
Thank you
Your comment has been submitted and will be published once it has been approved.
OOPS!
Your comment has not been submitted. Please go back and try again. Thank You!
If this error persists, please open an issue by clicking here.